Unlock the power of TradingView's drawing tools and elevate your technical analysis. This comprehensive guide unveils the secrets to mastering key features, from trendlines and Fibonacci retracements to advanced chart patterns. Learn how to identify potential trading opportunities, refine your strategies, and gain a competitive edge by visualizing market dynamics with precision and confidence. Prepare to transform your chart reading and trading decisions.
Methods: Trendline Analysis
Step-by-Step Instructions
-
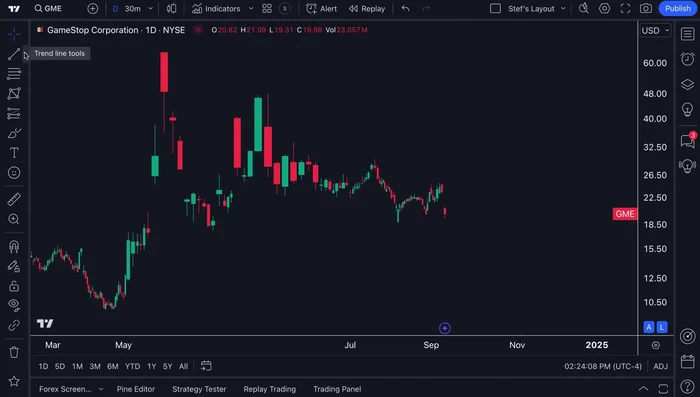
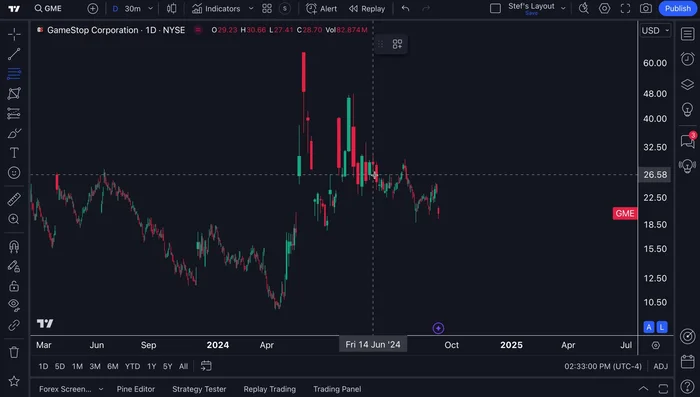
Accessing Trendline Tools
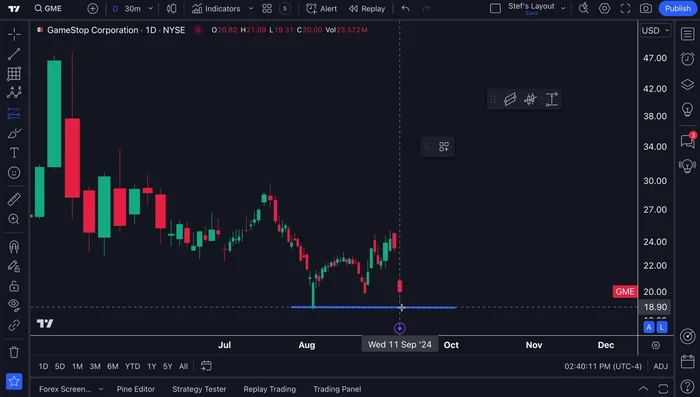
- Locate the drawing tools on the left-hand side of the TradingView chart.
- Select the trendline tool.

Accessing Trendline Tools -
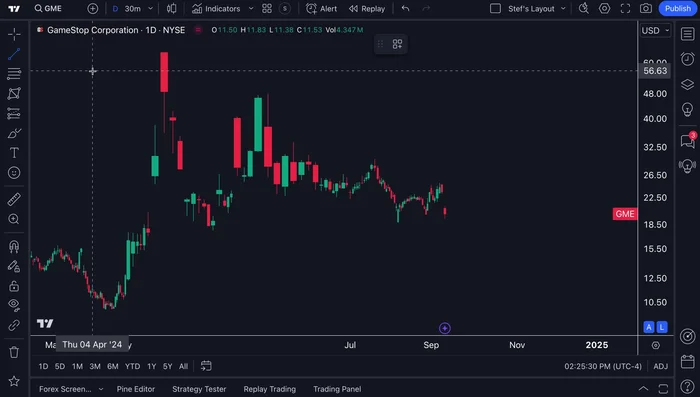
Drawing the Trendline
- Click on two points on the chart to draw the trendline. The line will follow your mouse until you click again.
Drawing the Trendline -
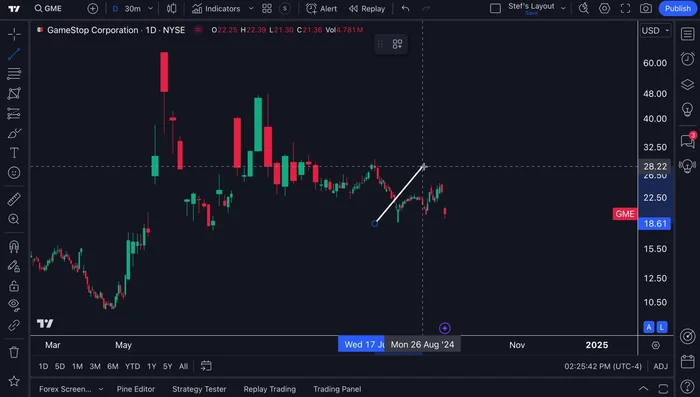
Refining the Trendline
- Adjust the trendline to match the desired trend (upward or downward).
Refining the Trendline

Tips
- Double-click the trendline to access the settings menu for customization.
- Customize line style (solid, dashed, dotted), color, thickness, and add arrows or text labels.
- Use the 'extend line' feature to extend the trendline across the entire chart.
Methods: Fibonacci Retracement Analysis
Step-by-Step Instructions
-
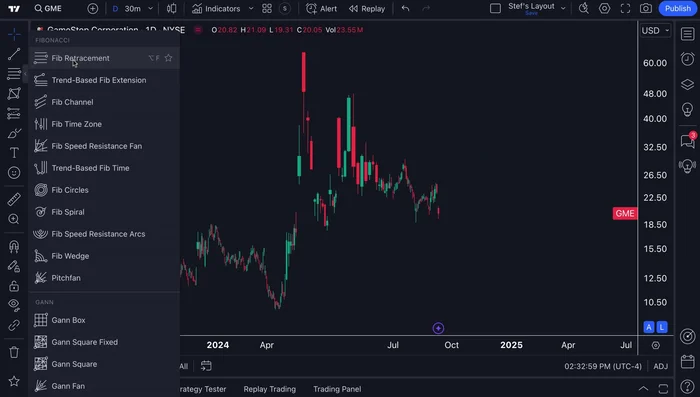
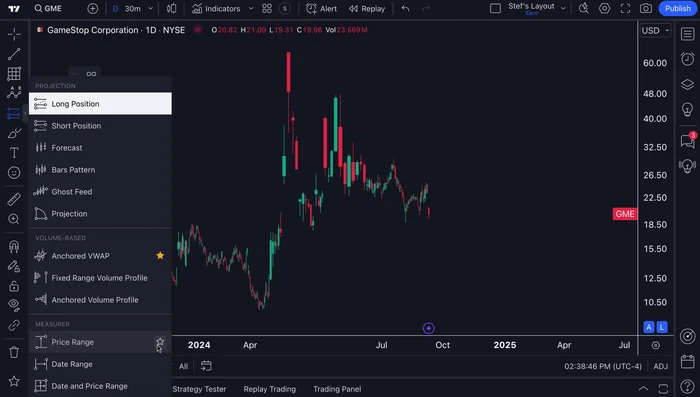
Select the Tool
- Select the Fibonacci retracement tool.
Select the Tool -
Draw the Retracement
- Click on a swing high and a swing low to create the retracement levels.
Draw the Retracement
Tips
- Double-click the Fibonacci retracement to customize colors and add more Fibonacci levels.
Methods: Price Range Measurement
Step-by-Step Instructions
-
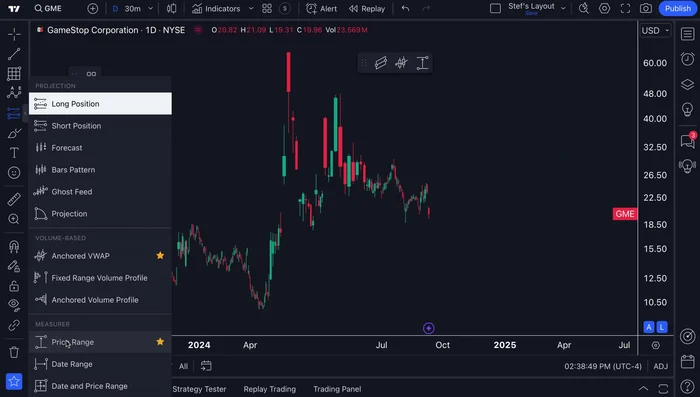
Selecting the Measurement Tool
- Select the price range tool.
Selecting the Measurement Tool -
Measuring Price Range
- Click on two points on the chart (e.g., a high and a low) to measure the price change and percentage change.
Measuring Price Range
Tips
- The tool automatically calculates and displays the price change in both absolute and percentage terms.
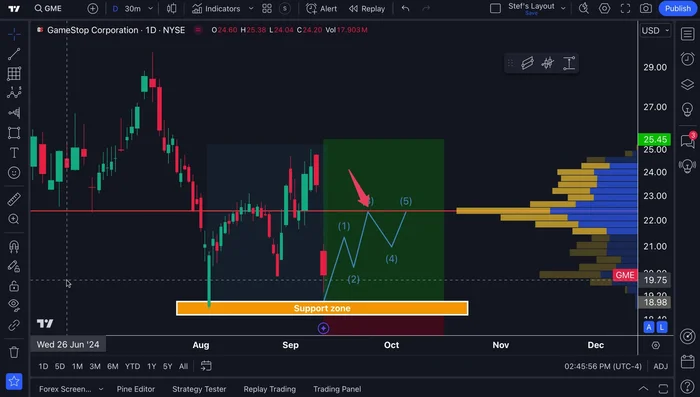
Methods: Long/Short Position Mapping with Geometric Shapes
Step-by-Step Instructions
-
Initiate Long Position Mapping
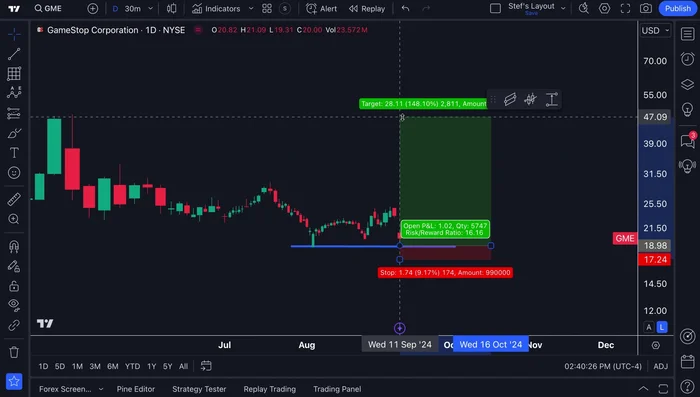
- Select the long position tool.
Initiate Long Position Mapping -
Define Trade Entry and Exit
- Click on the chart to define entry and exit points.
Define Trade Entry and Exit -
Set Risk Management Parameters
- Set stop-loss and take-profit levels.
Set Risk Management Parameters -
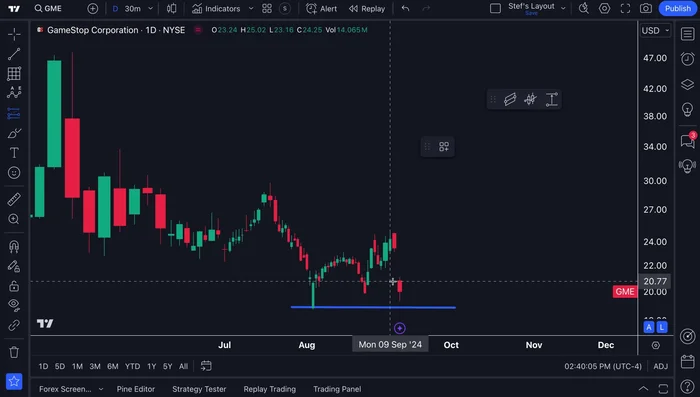
Enhance Visualization with Geometric Shapes
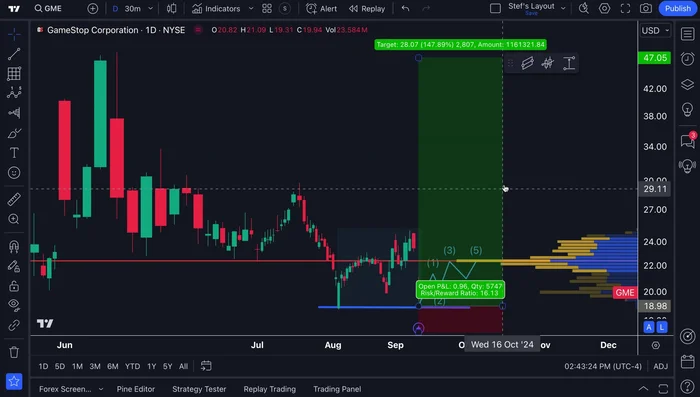
- Use geometric shapes (rectangles, etc.) to highlight key support/resistance zones.
Enhance Visualization with Geometric Shapes
Tips
- Combine this with other drawing tools (e.g., trendlines, Elliot waves) for comprehensive trade planning.
- Use volume analysis tools to confirm trade setups based on volume.
Methods: Price Note Annotation
Step-by-Step Instructions
-
Create a Price Note
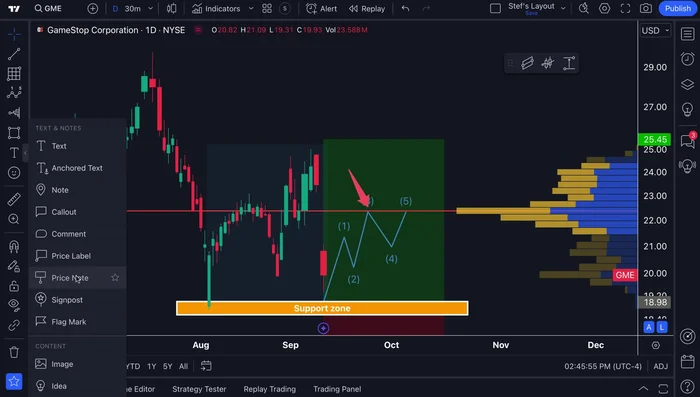
- Select the price note annotation tool.
- Click on a specific price level on the chart to create a persistent price note.
Create a Price Note
Tips
- Price notes move with the price, ensuring they remain relevant as the chart updates.
Common Mistakes to Avoid
1. Overusing Drawing Tools
Reason: Too many indicators and drawings on a chart can create visual clutter, making it difficult to identify key patterns and price action.
Solution: Simplify your chart by focusing on a few key indicators and drawing tools relevant to your trading strategy.
2. Ignoring Context and Confirmation
Reason: Relying solely on chart patterns identified with drawing tools without considering other factors like volume, overall market trend, and fundamental analysis can lead to inaccurate predictions.
Solution: Always corroborate your findings from drawing tools with other forms of technical and fundamental analysis before making trading decisions.
FAQs
What are the most essential drawing tools on TradingView for beginners?
For beginners, mastering the line tools (horizontal, trend, and Fibonacci retracement) and the rectangle tool are crucial. These help identify support/resistance, trendlines, and potential reversal points. Learn these first before exploring more advanced tools.
How can I effectively use drawing tools to avoid chart clutter and improve readability?
Avoid overdrawing! Focus on a few key levels and patterns. Use different colors and line thicknesses to distinguish between different tools and timeframes. Regularly clean up your chart by deleting outdated drawings. Consider using the 'show/hide' feature to manage chart elements.
Are there any TradingView drawing tools specifically designed for identifying candlestick patterns?
While there isn't a dedicated tool *just* for candlestick patterns, you can use the rectangle, line, and annotation tools to highlight patterns manually. Combining these with the measurement tools can help you analyze the size and significance of the patterns.